How to Learn R Programming for AI in 2026
Hey there! Thinking about learning R? It might seem like a huge mountain to climb, but trust me, it’s more straightforward than you’d imagine. The real secret is starting with the right tools, getting a solid grip on fundamental concepts like data frames, and then jumping right into building projects that mirror what you’d do in the real world of data science and AI.
Why R Is Your Secret Weapon for Data Science and AI
Let’s get this out of the way: you've heard a lot about Python. But R is making a huge comeback, and now is the perfect time to add it to your skillset. This isn't just another language tutorial; it's about showing you why R's unparalleled strength in statistics and data visualization makes it an essential tool for anyone serious about a career in AI.
Think of this guide as your friendly roadmap, written especially for beginners. We'll cover not just how to write R code, but why it works the way it does. R is a specialist's tool, perfectly designed for deep statistical dives and crafting compelling data stories.
A friend of mine, a senior data scientist at a major tech company, put it perfectly the other day: "When I need to statistically validate a new AI model, nothing gives me the clarity and power R does. It’s my go-to for proving our models are actually as smart as we think they are."
That’s the core of it. Learning R is a strategic move, especially as the need to validate and interpret complex AI models grows. It's not just about building something; it's about understanding it and proving its value. That’s where R really shines.
The Resurgence of R in the AI Era
The comeback story for R isn't just talk; the data backs it up. R has seen a significant resurgence, making this the perfect moment to learn it, especially if you're interested in AI-driven data analysis.
According to the TIOBE Index for January 2026, R jumped from 18th place just a year ago to 10th place, with a rating of 1.82%. This brings R back into the top 10 for the first time since 2020, largely fueled by its dominance in statistical work and its crucial role in the AI boom.
This chart really puts R's recent journey into perspective.
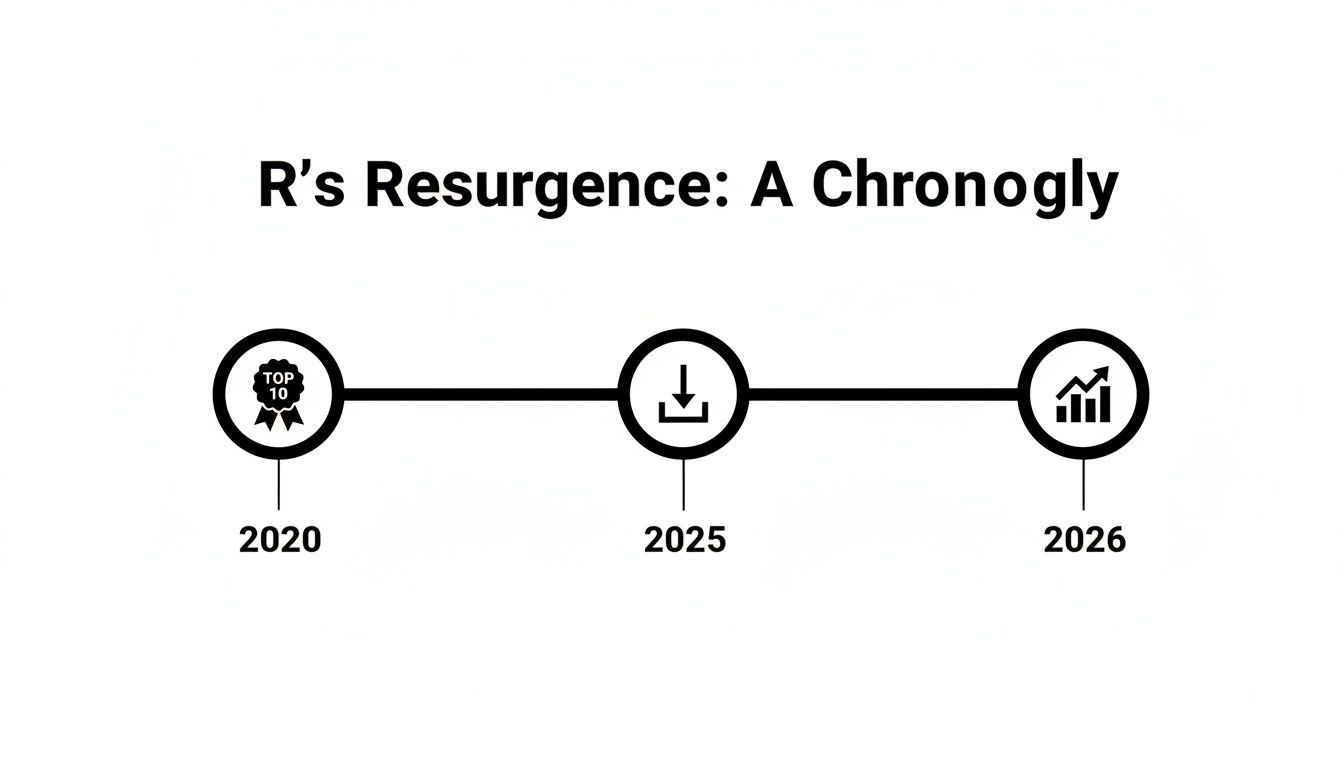
The numbers make it clear: R skills are becoming more valuable in the job market, and its relevance is only growing.
Your Path Forward With R and AI
So, what does this mean for you? It means learning R equips you with a skill that is not only in high demand but also deeply respected for its analytical rigor. R lets you go beyond surface-level metrics and truly interrogate your data.
To help you visualize the path ahead, here's a quick look at the learning stages we'll be covering. It breaks down the main focus for each phase and a realistic timeline to get you started.
Your R Learning Roadmap at a Glance
| Learning Stage | Key Focus | Estimated Time |
|---|---|---|
| Weeks 1-2 | Setup & Basics: Installing R/RStudio, learning core syntax, variables, and basic commands. | 10-15 Hours |
| Weeks 3-4 | Data Structures & Tidyverse: Mastering data frames, tibbles, and the dplyr & tidyr packages. |
20-25 Hours |
| Weeks 5-6 | Data Visualization: Creating insightful plots and charts with ggplot2. |
15-20 Hours |
| Weeks 7-8 | Statistical Modeling & ML: Running statistical tests, building models with tidymodels. |
25-30 Hours |
| Ongoing | Projects & Practice: Applying skills to real datasets and building a portfolio. | Continuous |
This roadmap provides a structured approach, but remember that the real learning happens when you start applying these concepts.
Your journey will focus on a few key areas:
- Building Statistical Foundations: Truly understanding the statistical engines that power modern AI.
- Creating Powerful Visualizations: Learning to tell compelling stories with your data using
ggplot2. - Developing Predictive Models: Applying your new skills to build models that solve actual problems.
As you get more comfortable, you’ll see how well R skills complement other data science abilities. To push your AI skills even further, you could explore specialized Generative AI courses that build on the strong analytical foundation you'll gain from R.
Now, let’s break down exactly how you can learn R, step-by-step.
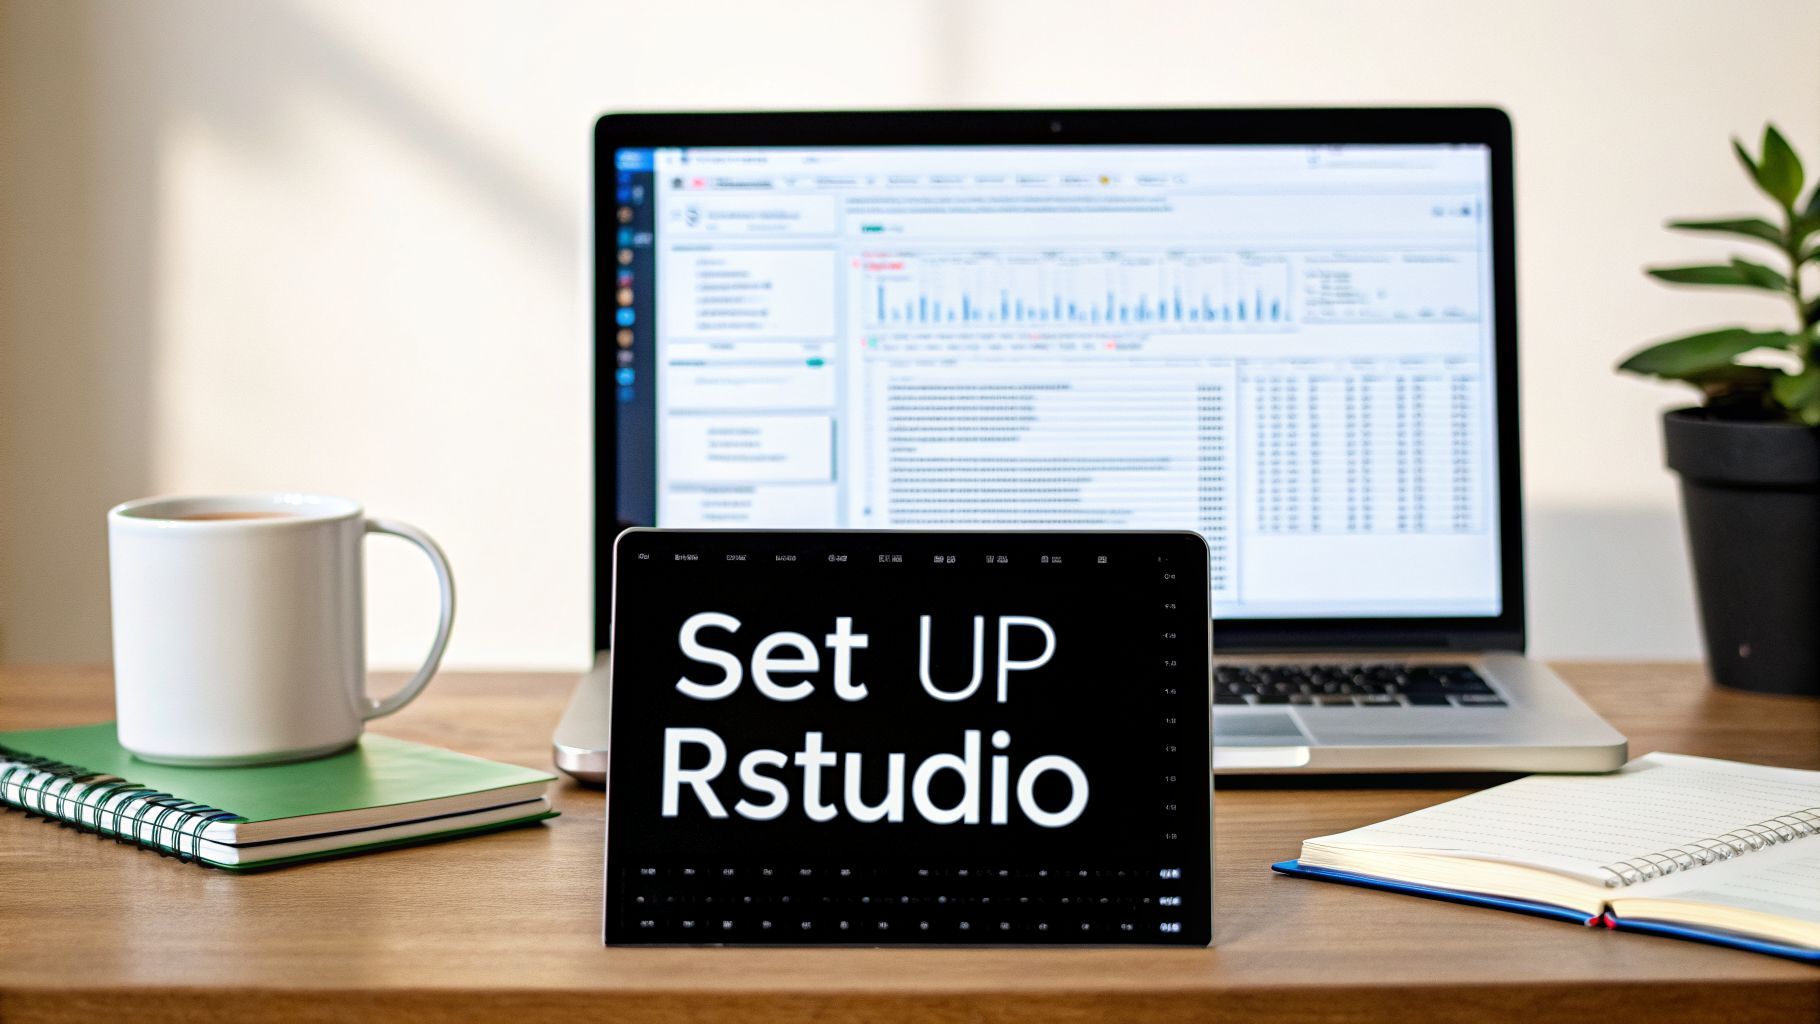
Setting Up Your R Development Environment
Before you can write a single line of code, you need to get your workshop in order. For R, this means installing two things: R itself, which is the core programming language, and RStudio, which is the environment where you'll actually do your work.
Think of it this way: R is the engine, and RStudio is the entire car built around it—the dashboard, the steering wheel, the GPS. You technically could just use the engine, but it wouldn't be a very pleasant or productive ride.
I tell every beginner the same thing: install RStudio from day one. It's not a crutch; it's a professional tool that makes coding, debugging, and visualizing results feel intuitive instead of frustrating. It dramatically flattens the learning curve.
Installing Your R Essentials
This is a two-step dance, and the order is critical. You have to install R first, because RStudio is simply a user interface that needs to connect to an existing R installation on your machine.
First, head over to the Comprehensive R Archive Network (CRAN). This is the official home for R. You’ll see download links for Linux, macOS, and Windows. Just grab the installer for your system and run it, accepting all the default settings.
Once R is on your computer, go to the Posit website and download the free RStudio Desktop version. Run that installer, and it will automatically find the version of R you just installed. Easy.
From now on, you'll only ever open RStudio. It handles everything behind the scenes.
A Quick Tour of RStudio
The first time you launch RStudio, you'll be greeted by a screen with several panels. It might look a little busy, but don't worry, you'll get the hang of it fast.
- Script Editor (Top-Left): This is where you'll live. It's a simple text editor where you write and save your R scripts (
.Rfiles). This is where your analysis takes shape. - Console (Bottom-Left): This is the engine room. When you run code from your script, it executes here. You can also type commands directly into the console for quick tests or calculations. This is also where R will yell at you with error messages.
- Environment/History (Top-Right): The Environment tab is your best friend. It shows you every object—data frames, variables, functions—that currently exists in your session. It’s an at-a-glance look at what you’re working with.
- Files/Plots/Packages (Bottom-Right): This handy pane has multiple tabs. You can use it to browse files on your computer, view the plots and charts you create, and manage your installed packages.
Your First Package Installation
Packages are what make R so powerful. They're collections of code, data, and documentation that other users have created to solve specific problems. With over 21,000 packages available on CRAN, if you need to do something, there's a good chance someone has already built a tool for it.
Let's install the most essential package collection for anyone doing data science: the tidyverse. This isn't just one package but a whole suite of them designed to work together seamlessly for data manipulation and visualization.
To install it, just type this command into your RStudio Console (the bottom-left pane) and hit Enter:
install.packages("tidyverse")
R will take a few minutes to download and install everything it needs. Once it's finished, you've successfully equipped your R setup with a world-class data science toolkit.
As you get more advanced, you'll want to isolate project environments to keep dependencies from conflicting. For that, learning how to create and manage Docker containers is a fantastic skill for any serious developer.
Grasping the Fundamentals of R Programming
Alright, you’ve got RStudio installed and ready to go. Now comes the fun part: learning to actually think like an R programmer. We’re going to skip the dense computer science theory and focus on the practical building blocks you need to start working with data right away.
At its heart, R is all about manipulating data. To do that, we first need a way to store information. This is where variables come in. Think of a variable as a labeled container where you can stash a piece of information, like a number or a bit of text.
Core Concepts: Variables and Data Types
In R, you assign a value to a variable using a quirky little arrow: <-. While most other languages use a simple equals sign (=), you'll quickly grow to love the clarity of the arrow. It always means "put the thing on the right into the container on the left."
For instance, let's create a variable called my_age and give it a value of 30.
my_age <- 30
Simple as that. Now, R knows that my_age holds the numeric value 30. That value has a specific data type, which tells R how to handle it. You’ll constantly be working with a few key types:
- Numeric: Any number you can think of, with or without a decimal (
10.5,-5). - Character: Plain text, which always needs to be wrapped in quotes (
"hello","data science"). - Logical: A simple
TRUEorFALSEvalue. These are the foundation for making decisions and controlling the flow of your scripts.
Getting these basic types down is the first step. The next is seeing how R organizes them into structures built for real-world analysis.
Vectors and Data Frames: Your Primary Tools
A single number or piece of text is fine, but data analysis is all about collections of data. R's most fundamental collection is the vector. A vector is just a one-dimensional list of items that all share the same data type.
You create them with the c() function, which is short for "combine."
# A vector of numbersmonthly_sales <- c(2500, 3100, 2800, 4200)
# A vector of textteam_members <- c("Alice", "Bob", "Charlie")
This is a big step up, but the real power comes when you stack these vectors together to create a data frame.
I like to describe a data frame as a supercharged spreadsheet that you control entirely with code. It’s a two-dimensional table with rows and columns, just like in Excel, but infinitely more flexible and powerful for analysis.
The data frame is, without a doubt, the most important structure you will use in R. It's the standard way you'll work with datasets, whether you're loading a CSV file or pulling from a database. Each column in a data frame is a vector, and every column has to have the same number of rows. This tidy format—where each row is an observation and each column is a variable—is the key to effective analysis.
The Great Debate: Base R vs. The Tidyverse
As you start your R journey, you'll quickly run into a friendly debate in the community: Base R or the Tidyverse?
- Base R is the set of functions that comes built-in with R. It's been around forever and is incredibly powerful, but the syntax can feel a bit clunky and inconsistent, especially for data manipulation tasks.
- The Tidyverse is a curated collection of packages (
dplyr,ggplot2, etc.) that all share a common design philosophy. The result is a more intuitive and readable syntax for modern data science.
As an R expert, my advice is simple: while a basic familiarity with Base R is useful, I strongly recommend beginners start with the Tidyverse. Its consistent grammar makes the learning curve much smoother and more enjoyable. You'll get that "I can do this!" feeling much sooner, which is crucial for staying motivated.
The R ecosystem is massive and growing. The main package repository, CRAN, surpassed 21,000 packages by early 2026—a 15% jump from 2024. This growth includes essential tools like dplyr, which a 2025 RStudio survey of 5,000 users found is used by an estimated 80% of R practitioners. To get a sense of R's impact, you can see how its popularity stacks up against other languages in these programming language popularity statistics.
Let's see a quick example. Say you have a data frame of sales and want to find all transactions over 3000.
The Base R way:high_sales <- sales_data[sales_data$amount > 3000, ]
The Tidyverse way (using dplyr):high_sales <- sales_data %>% filter(amount > 3000)
The Tidyverse code reads like a sentence: "Take the sales data, then filter for rows where the amount is greater than 3000." This readability is a game-changer, especially as your code gets more complex.
By focusing on the Tidyverse, you're learning a modern, efficient workflow that makes data work feel less like a chore and more like a creative puzzle. Building this foundation is key, especially when you're ready for more advanced topics like creating powerful data visualizations in R.
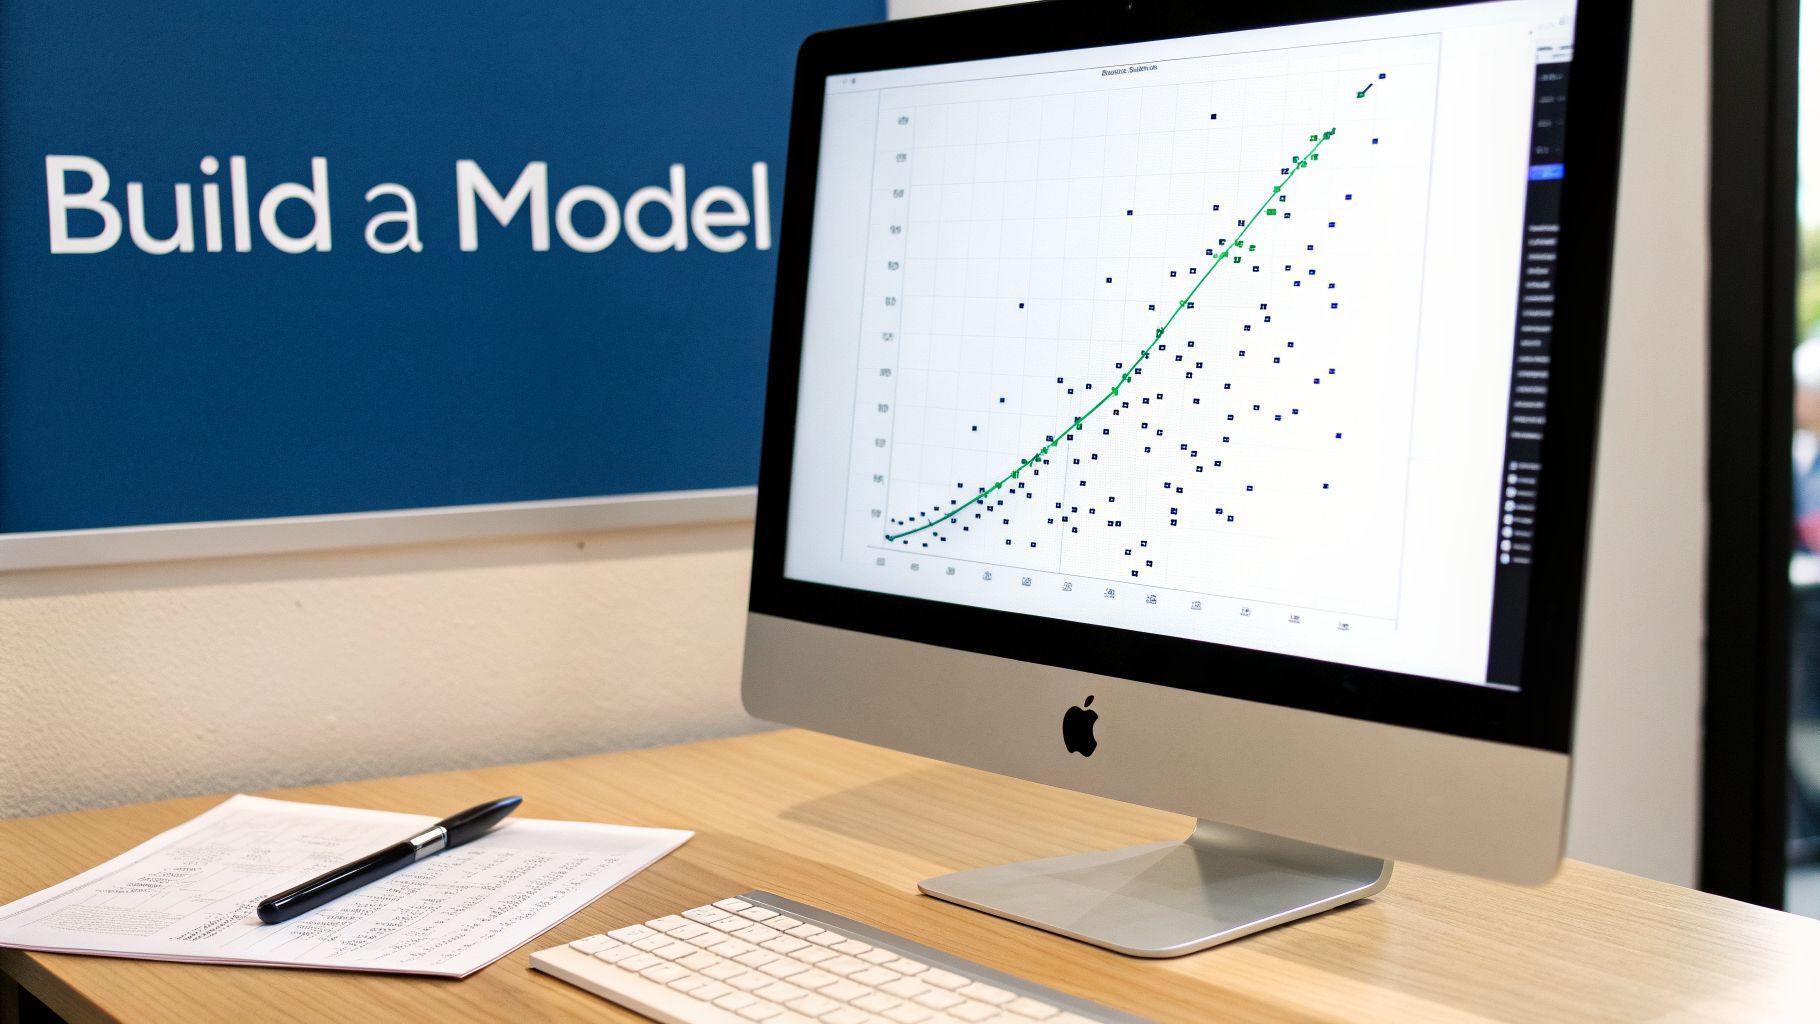
Your First Real Project: A Predictive Model
Alright, you've got the basics down. Now it’s time to move beyond syntax and theory and build something real. This is where your R skills start to pay off, as we dive into a project with direct applications in the world of AI: building a predictive model from the ground up.
We'll walk through the entire machine learning workflow together, taking the mystery out of the process.

Our objective is straightforward but powerful: we're going to predict a value using other pieces of information. This is the fundamental concept behind countless AI systems, whether they're recommending products on an e-commerce site or forecasting supply chain demand.
To keep things grounded, we'll use a classic dataset you can find on sites like Kaggle: housing prices. It gives us a clear and tangible goal. Can we accurately predict a house's sale price based on its features?
The Rhythm of a Machine Learning Project
Every machine learning project, from a quick analysis to a massive production system, follows a similar rhythm. Internalizing this flow is far more important than memorizing code, as it gives you a reliable map for any data problem you encounter.
It’s an iterative loop: you load and clean your data, explore it to build intuition, prepare it for modeling, and then train and test an algorithm. You’ll find yourself constantly cycling through these stages—exploring, modeling, evaluating, and then going back to explore some more based on what you learned. This is the daily work of an applied data scientist.
Why We’re Starting with Tidymodels
For this project, we're jumping straight into tidymodels. Think of it as the machine learning-focused sibling of the Tidyverse. It’s a modern, cohesive collection of packages that makes the entire modeling process feel consistent and clean.
My advice is to embrace
tidymodelsright from the beginning. While you'll definitely see older, powerful packages likecaretin the wild,tidymodelsis where the R ecosystem is heading. Its syntax flows beautifully withdplyrandggplot2, making your whole analysis feel like it's written in a single, unified language.
Learning R for AI is a smart career move, and the data backs it up. In the first quarter of 2026, Indeed.com listed R skills in over 120,000 US job postings—a 22% jump from the previous year. Those roles also tend to pay well, with salaries averaging $125K, about 15% higher than many general developer positions. And while tidymodels is the future, R's deep roots in machine learning are undeniable; the caret package alone was used in over 50% of Kaggle competitions won by R users in 2025.
Loading and Exploring the Data
First things first, let's get our environment ready and load the data. We'll pull in our packages and use readr to import the housing data from a CSV file.
# Load our core packages
library(tidymodels)
library(tidyverse)

# Load the housing data from a CSV file
# You'd replace "housing_prices.csv" with the actual path to your file
housing_raw <- read_csv("housing_prices.csv")

# Take a quick look at the first few rows
glimpse(housing_raw)
With the data in our session, the real fun begins: exploration. Let's use ggplot2 to ask a simple question. How does the year a house was built relate to its sale price?
ggplot(housing_raw, aes(x = YearBuilt, y = SalePrice)) +
  geom_point(alpha = 0.4) + # Use semi-transparent points
  geom_smooth(method = "gam") + # Add a smoothing line
  scale_y_continuous(labels = scales::dollar) + # Format y-axis as dollars
  labs(title = "Sale Price Tends to Increase with Year Built")
Just from that one plot, we get a valuable insight: newer houses generally command higher prices. This kind of exploration is absolutely critical; it’s how you spot the patterns that will eventually power your model.
Building a Simple Decision Tree
Now, let's build our first model. We'll start with a decision tree, an intuitive algorithm that works by learning a series of "if-then" rules from the data.
Before we can train anything, we need to split our data. A standard practice is to use 80% of the data for training the model and reserve the remaining 20% to test how well it performs on data it's never seen before.
# Set a seed for reproducibility so we get the same split every time
set.seed(123)

# Create the data split
housing_split <- initial_split(housing_raw, prop = 0.80)

# Create the training and testing sets
train_data <- training(housing_split)
test_data  <- testing(housing_split)
Next, we'll define the "recipe" for our model. In tidymodels, a recipe is a set of steps for pre-processing the data, like specifying our outcome (SalePrice) and predictor variables. We also define the model itself—in this case, a decision tree.
# Define the model type - a decision tree for regression
tree_spec <- decision_tree() %>%
  set_engine("rpart") %>%
  set_mode("regression")

# Define the recipe: predict SalePrice using these three variables
housing_recipe <- recipe(SalePrice ~ Neighborhood + YearBuilt + TotRmsAbvGrd, data = train_data)

# Create the workflow that bundles the model and recipe
tree_workflow <- workflow() %>%
  add_model(tree_spec) %>%
  add_recipe(housing_recipe)
With our recipe and model combined into a workflow, the final step is to train—or fit—the model on our training data.
# Train the model
tree_fit <- fit(tree_workflow, data = train_data)
And that’s it. You've officially trained a predictive model. The tree_fit object holds a complete decision tree, ready to predict the price of a new house given its neighborhood, construction year, and room count. From here, you’re ready to explore model evaluation and more complex algorithms.
A great next step would be to tackle a different kind of algorithm, like K-Nearest Neighbor. To see how that works, you can check out our detailed guide on implementing K-Nearest Neighbor in R.
Adopting Professional R Programming Habits
Getting a predictive model to run is a fantastic feeling, but it's only half the battle. What truly separates a one-off analysis from professional, repeatable data science is your workflow. Moving from hobbyist to pro means building habits that make your work easy to understand, reproduce, and share with colleagues or clients.
It’s time to move past just writing code that works. Let’s focus on organizing your projects so that "future you"—and everyone else—can trust and build upon your analysis. This is a crucial leap when you want to use R in a real-world job.
Crafting Reports with R Markdown
One of the most powerful tools in the R ecosystem is R Markdown. This isn’t just for making things look pretty; it's a framework for what's called literate programming. It lets you weave your narrative, your R code, and its output (like plots and tables) into a single, cohesive document.
Imagine handing your manager a report that not only explains your findings but also shows the exact code that produced them. It’s a massive boost for transparency and credibility.
Instead of the old-school copy-and-paste from your console into a Word doc, you create a dynamic report. If the underlying data changes, you just click a button to regenerate the whole thing. It's incredibly versatile, letting you export to:
- HTML: Perfect for interactive web-based reports.
- PDF: For formal papers or polished client-facing documents.
- Word: Great for collaborating with teammates who don't code.
The Non-Negotiable Habit: RStudio Projects
If you're still working from loose R scripts on your desktop, stop. Today. Start using RStudio Projects. A Project is simply a self-contained folder that bundles all the files for a specific analysis—your scripts, data, reports, and everything else.
This one simple habit solves so many common frustrations. File paths become relative, so your code won't break when you move the project folder or email it to a colleague. It also keeps your R session clean, preventing variables from one analysis from accidentally creeping into another.
I’ve seen countless hours torched because an analyst couldn't reproduce their own results from six months prior. Using RStudio Projects is the first and most important step toward true reproducibility. It's a free habit that pays you back every single day.
A Gentle Introduction to Version Control
The next level up is embracing version control with Git and GitHub. This might sound intimidating, but the concept is straightforward: it’s a system for tracking changes to your files over time.
Think of it as "Track Changes" on steroids, but for your entire project.
- Git is the software on your machine that logs every change you save.
- GitHub is the website where you can store a copy of your project, share it, and collaborate with others.
Using Git lets you experiment without fear. If you mess something up, you can easily rewind to a previous working version. Pushing your code to GitHub not only backs it up but also builds a public portfolio you can show to potential employers.
Continuing Your Learning Journey
The R community is one of the most active and welcoming out there. Staying engaged is the best way to keep your skills sharp. Here are a few resources I still turn to regularly:
- R for Data Science: Written by Hadley Wickham and Garrett Grolemund, this book is the bible of modern data science in R. It's free online and an essential reference.
- R-Bloggers: This site pulls together blog posts from hundreds of R users worldwide. It's the best way to discover new packages and clever techniques.
- #TidyTuesday: This is a weekly data project on Twitter where the community tackles the same dataset. It's a fantastic way to practice, get feedback, and see how others approach a problem.
By making these tools and habits part of your daily routine, you'll be well on your way from simply writing R code to being a professional, proficient R programmer.
Your Questions About Learning R, Answered
When you’re first starting out, it's completely normal to have a head full of questions and a little bit of doubt. Everyone has been there. Let's walk through some of the biggest questions I hear from new R programmers, and hopefully, give you a final shot of confidence.
Is R Hard to Learn for a Beginner?
This is the big one, isn't it? The honest truth: it's more straightforward than you'd expect, but it requires consistency. If you’ve dabbled in other programming languages, you'll see a lot of familiar ideas. But even if you're a total newcomer to code, R is a surprisingly great place to start.
The trick is to begin with the right tools. By jumping straight into the tidyverse, you're working with a version of R that’s built to be intuitive. Its functions read like verbs—filter(), select(), mutate()—making your code feel like a set of simple instructions. This collapses the time it takes to get from zero to actually doing something useful.
If I could give just one piece of advice to a beginner, it would be this: commit to 30 minutes of practice every single day. Forget about cramming for eight hours on a weekend. Short, consistent sessions build real muscle memory and stop you from feeling completely swamped. The initial learning curve is steep, but it levels out much faster than you think.
Should I Learn R or Python for Data Science?
Ah, the great R vs. Python debate. The short answer is you can't lose with either, but they have their own sweet spots. Frankly, the best data scientists I know are comfortable with both.
Here's how I see it breaking down:
- Choose R if you're drawn to: Deep-dive statistical analysis, academic research, crafting top-tier data visualizations, and truly understanding the why behind the numbers. R's packages for stats and reporting are simply world-class.
- Choose Python if your main goal is: Putting machine learning models into production software, general-purpose coding, and integrating your work into web apps or larger engineering systems.
For anyone charting a course toward a career in data analysis, business intelligence, or scientific research, R is a fantastic choice. Its entire community is steeped in statistics, which gives you an incredibly strong foundation for thinking about data.
Am I Too Late to Learn R?
Not a chance. In fact, your timing is perfect. The industry is seeing a huge demand for people who can do more than just build a model—they need experts who can rigorously test it, validate its findings, and explain what it all means. This is R's home turf.
While Python often grabs the headlines for building the initial model, R is what specialists turn to for deep statistical inference and communicating results with clarity and impact. Many companies are actively building teams with both skill sets—Python pros to build the infrastructure and R experts to make sure the decisions it drives are sound. Learning R right now positions you to be that expert.
How Long Does It Take to Become Proficient?
This really comes down to your background and how much time you can put in. But if you practice consistently, you can follow a pretty predictable timeline.
- 1–2 Months: You'll have the basics down cold. You’ll be wrangling data with the tidyverse, building sharp-looking plots with ggplot2, and feeling comfortable with R's core syntax.
- 3–6 Months: You'll be capable of running a full analysis from start to finish. This means taking messy raw data, cleaning it up, doing exploratory work, running statistical tests, and even building some basic predictive models.
- 6–12+ Months: This is when you start to feel genuinely proficient. You’ll find yourself tackling complex projects, picking up new packages on your own, and writing clean, reproducible code that you’d be proud to share.
Remember, "proficient" is always a moving target. The real goal is to get to a place where you can confidently solve problems with R and know exactly where to look for answers when you get stuck. With the right strategy, you'll be there before you know it.
Ready to dive deeper and stay ahead in the world of artificial intelligence? At YourAI2Day, we provide the latest news, tools, and insights to help you grow. Check out our resources to continue your AI learning journey at https://www.yourai2day.com.