Difference Between T Test and Z Test A Guide for AI
You’ve probably been in this spot before. You ship a new model variant, run a quick experiment, and the numbers look a little better. Maybe your recommendation model gets a slightly higher click rate. Maybe your chatbot keeps users engaged a bit longer. The hard part isn’t measuring the difference. The hard part is deciding whether that difference is real.
That’s where people often bump into the difference between t test and z test.
On paper, the distinction can look simple. In practice, it trips up beginners and experienced teams alike, especially in AI work where data is messy, user behavior is uneven, and “known population variance” is almost never a real thing. If you’ve ever heard “just use z when n is above 30,” this article is for you.
I’m going to walk through this the way I’d explain it to a junior data scientist on my team. We’ll keep the math light, focus on intuition, and tie every choice back to real model evaluation and experimentation.
Choosing the Right Test for Your AI Model
You train two versions of a recommendation system.
Model A is your baseline. Model B adds a new ranking signal. After a limited test, Model B looks better. The temptation is to celebrate, merge the code, and move on. But small differences can happen just because of random variation in users, sessions, or traffic.
That’s why hypothesis testing matters. It helps you answer a practical question: is the improvement likely to be real, or did this sample just happen to lean your way?
Here’s the short version:
| Criterion | Z-Test | T-Test |
|---|---|---|
| Population standard deviation | Must be known | Can be unknown |
| Typical real-world use | Rare | Common |
| Distribution used | Standard normal | t-distribution |
| Small sample handling | Weaker when variance is estimated | Better suited |
| Best fit for AI work | Controlled, unusual cases | Most experiments and A/B tests |
A lot of teams make this harder than it needs to be. They memorize a rule, something about sample size, then apply it everywhere. That works in a classroom. It breaks down fast in product analytics, ML validation, and model comparison.
Most AI data isn’t neat. Session times can be skewed. Latency can have long tails. Error metrics can cluster in weird ways. Before you even run a test, your upstream pipeline matters too. If the data collection and feature handling are shaky, your statistical conclusion won’t save you. That’s why solid data preparation for machine learning comes first.
Practical rule: Don’t start with “How big is my sample?” Start with “Do I know the population variance?” For most AI projects, the answer is no.
That answer pushes you toward the t-test far more often than many beginner guides admit.
What Is a Hypothesis Test Anyway
A hypothesis test is just a structured way to judge evidence.
Consider it a court case. You begin with a default position called the null hypothesis. In plain English, it says there’s no real effect. If you’re comparing two models, the null is “there’s no meaningful difference between them.”
The competing claim is the alternative hypothesis. That’s the effect you hope your data supports, such as “Model B performs better than Model A.”
The court trial analogy
In a trial, the defendant starts as “not guilty.” The court doesn’t try to prove innocence. It asks whether the evidence is strong enough to reject that starting assumption.
A hypothesis test works the same way.
- Null hypothesis: No difference, no effect, no improvement.
- Alternative hypothesis: There is a difference, effect, or improvement.
- Sample data: Your evidence.
- Test statistic: The summary of how far your result is from the null.
- P-value: A measure of how surprising your result would be if the null were true.
If the p-value is small, your observed result would be unusually hard to explain by chance alone. That gives you reason to reject the null.
What people often misunderstand
Beginners often hear “small p-value” and translate it as “my model is definitely better.” That’s too strong.
A p-value doesn’t prove your idea. It tells you how compatible your observed data is with the no-effect story. That’s an important difference.
It also doesn’t tell you whether the improvement is useful in practice. A tiny improvement can be statistically significant and still not matter to users or the business. That’s one reason it helps to understand your variable types and what exactly you’re measuring before you run any test. If you want a quick refresher, this guide to quantitative and qualitative data is a good foundation.
Good statistical testing doesn’t replace judgment. It sharpens it.
Why this matters in AI work
When you compare models, prompts, interfaces, or ranking changes, you’re usually looking at noisy samples, not the whole universe of future behavior. Hypothesis testing helps you avoid overreacting to noise.
That is the core of the difference between t test and z test. They’re both trying to answer the same question. They just handle uncertainty differently.
Meet the Z-Test The Textbook Ideal
You ship a model update, collect a large batch of user metrics, and someone on the team says, “We have plenty of data, so let’s use a z-test.” That sounds reasonable. It is also where a lot of AI teams make the wrong call.
The z-test is the clean version of mean comparison from textbooks. It uses the standard normal distribution and assumes the amount of variability in the population is already known, not estimated from the sample you just collected.
That assumption is the whole story.
In a factory with a tightly controlled process, a known population standard deviation can be realistic. In an AI product, it usually is not. User behavior shifts by cohort, season, interface changes, traffic source, and model updates. If you are measuring session length, click-through rate after a ranking tweak, or quality scores from human raters, you are almost always estimating variability from observed data.
So the z-test is best treated as an ideal-case tool. It works well when the environment is stable and the spread of the data is already established from a trusted reference process.
A useful analogy is calibration. The z-test works like an instrument that was calibrated in advance and is being used under the same controlled conditions. If those conditions hold, the readings are clean and efficient. If they do not, the output can look more certain than it should.
That is why the usual shortcut, “use z when n is over 30,” causes confusion. Sample size matters, but it is not the first question. In practice, ask these instead:
- Is the population standard deviation known independently of this sample?
- Is the data-generating process stable enough that this old variability estimate still applies?
- Are you working with measurements that are reasonably well-behaved, or are they skewed, heavy-tailed, or full of outliers?
Those questions fit real ML work better than a hard sample-size cutoff.
Large samples can make normal approximations more reasonable. They do not magically turn an unknown variance into a known one. And they do not clean up ugly data distributions by themselves. If your metric is noisy and your variance comes from the same sample you are testing, the z-test starts to look less like a standard choice and more like a theoretical convenience.
Here is the practical takeaway I would give a junior teammate. Use a z-test in controlled settings with a defensible, known population variance. Treat it as rare in day-to-day AI experimentation. In real projects, the challenge is usually not whether you crossed an arbitrary n threshold. The challenge is whether your assumptions match the messiness of actual product data.
Introducing the T-Test The Practical Workhorse
You train two model variants on a limited validation set. Version B looks better, but the result came from the same sample that also gave you your estimate of variability. That is the t-test’s home turf.
The t-test is built for the common case where you do not know the population standard deviation ahead of time, so you estimate it from the data in hand. In real AI work, that is usually the honest setup. You have a batch of latency measurements, accuracy scores across folds, or user-level outcomes from an experiment. You rarely have a trustworthy, fixed variability number waiting on a shelf.

Why the t-test is more cautious
Once you estimate variability from the sample, your test has to carry two jobs at once. It must judge the difference you observed and admit that your estimate of noise is itself uncertain.
The t-test handles that by using the t-distribution, which has heavier tails than the standard normal distribution. A practical way to read that is simple. The t-test asks for stronger evidence before calling a result statistically significant when the sample is small.
You can treat it like a built-in caution buffer.
With less data, that buffer is larger. As your sample grows and your estimate of variability gets steadier, the t-distribution starts to resemble the normal distribution more closely. So the gap between t and z shrinks over time, but the reason is improving precision, not a magic sample-size cutoff.
Degrees of freedom without the jargon wall
Degrees of freedom sounds more intimidating than it is.
For many basic t-tests, it is closely tied to sample size, often n – 1. The idea is that small samples give you fewer independent pieces of information for estimating variability. Fewer pieces of information mean more uncertainty. More uncertainty means a wider reference distribution and a harder threshold for declaring a win.
A quick mental model helps:
- Small sample: your noise estimate is wobbly
- Larger sample: your noise estimate is steadier
- Steadier estimate: the t-test behaves more like the z-test
That is the logic. No memorized ritual required.
Why this matters in AI and ML work
Small mistakes here create false confidence fast.
Suppose you are comparing two prompt strategies, two ranking models, or two onboarding flows. Early experiments often run on thin data, messy data, or both. If you use a method that treats your uncertainty as smaller than it really is, you raise the odds of shipping a change that looked good by luck.
That is why the t-test shows up so often in practice. It is not the “small sample test” in some narrow textbook sense. It is the test that matches the reality that your variance is usually estimated, your data is rarely perfect, and your first answer should include some humility.
The version many teams should prefer
For two independent groups, Welch’s t-test is often the safer default.
It does not assume both groups have the same variance. That matters more than many teams expect. One model may behave consistently for most users while another produces far more spread in response times or engagement. A plain Student’s t-test can miss that mismatch. Welch’s version handles unequal variability more gracefully without asking you to defend a fragile assumption.
So if a junior teammate asks for the practical difference between t test and z test, I would put it this way: the z-test fits a controlled textbook setup, while the t-test fits the kind of evidence you usually have during real model evaluation.
Z-Test vs T-Test A Head-to-Head Decision Framework
You are reviewing an A/B test for two model variants. One teammate says, “We have more than 30 samples per group, so use a z-test.” In a real AI workflow, that shortcut can send you in the wrong direction.
The better question is simpler and more practical. What uncertainty are you pretending is already solved?
A z-test assumes you already know the population variance. That is the textbook version of the world. A t-test accepts the messier reality that you usually estimate variability from the data you have. For model evaluation, prompt testing, latency analysis, or product experiments, that difference matters more than the old sample-size rule.
A practical comparison
| Criterion | Z-Test | T-Test |
|---|---|---|
| Population variance known | Required | Not required |
| Variability source | Fixed in advance | Estimated from sample |
| Reference distribution | Standard normal | t-distribution |
| Behavior with limited data | Can understate uncertainty | Reflects extra uncertainty |
| Unequal variances between groups | Usually not the first choice | Welch’s t-test handles this well |
| Fit for AI and ML experiments | Rare | Usually the safer default |
Why the n = 30 rule is too shallow
Sample size is only one part of the decision.
A larger sample does help the sampling distribution settle down. But AI data often arrives with skew, outliers, heavy tails, and unequal spread across groups. Response times, token usage, revenue per user, and engagement metrics are common examples. In those settings, “we crossed 30” does not suddenly make every z-test assumption reasonable.
That is why experienced analysts ask about variance and data shape before they ask about a threshold.
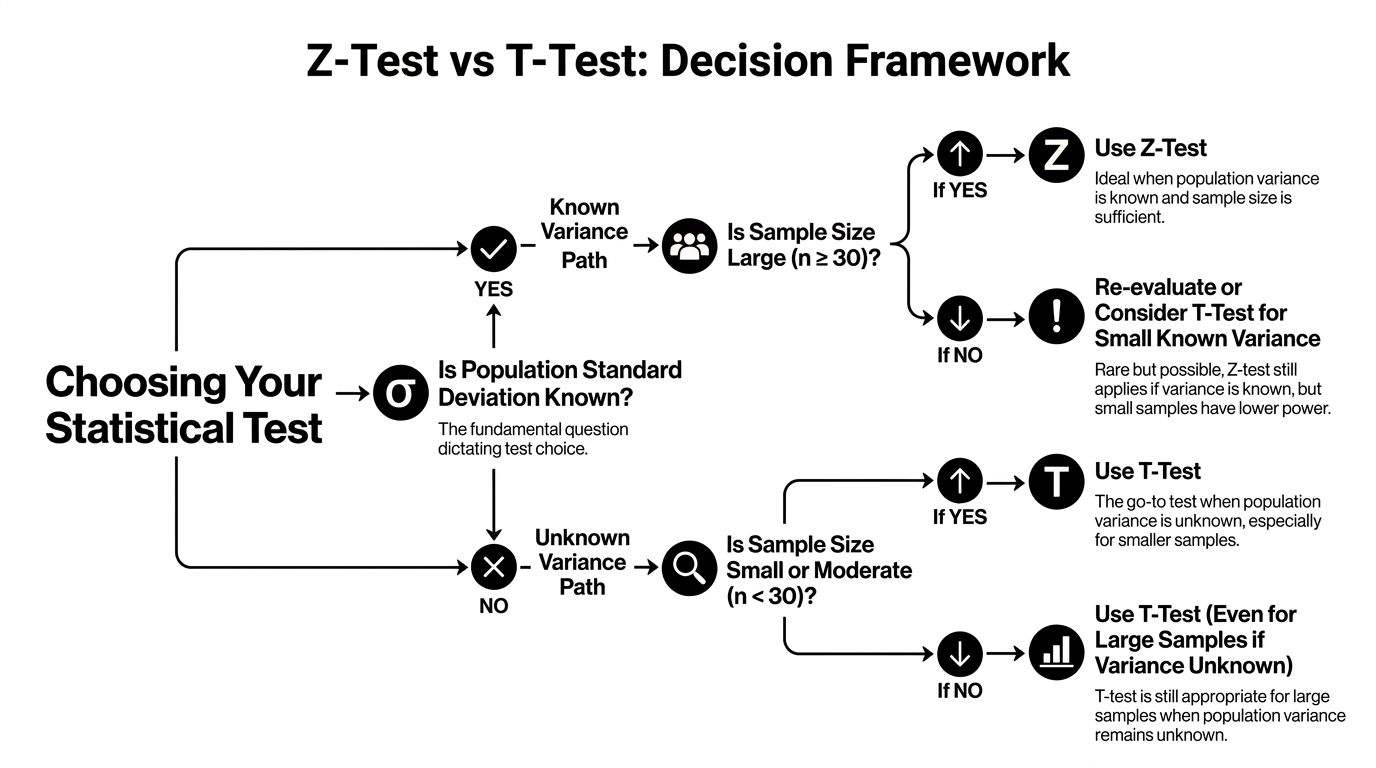
A better decision sequence
Use this checklist in order.
Are you testing a mean?
If yes, a t-test or z-test may fit. If you are testing proportions, counts, ranks, or something strongly non-normal, you may need a different method.Is the population variance known?
Historical data is not the same as a known population parameter. A previous quarter’s standard deviation, a benchmark report, or a training-set summary usually gives you an estimate, not certainty. In real projects, that pushes you toward a t-test.How ugly is the data?
Check a histogram, box plot, or summary stats. Strong skew and outliers should make you cautious. The test choice is not only about sample size. It is also about whether your assumptions match the metric.Are the group variances different?
If one model is steady and the other is erratic, use Welch’s t-test rather than the equal-variance version.Would a transformation or another test make more sense?
For heavily skewed metrics, a log transform, bootstrap approach, or nonparametric test may match the problem better than forcing either z or t into a bad setup.
The decision rule I would give a junior teammate
Use a z-test only when you can clearly defend the claim that population variance is known and the setup matches the textbook assumptions.
Use a t-test when variance comes from your sample, which is the normal case in applied AI and ML work.
Use Welch’s t-test when comparing two groups unless you have a strong reason to assume equal variances.
That framework is much closer to real project work than memorizing “below 30” and “above 30.”
If you’re teaching this to spreadsheet users or checking a result manually, the T-Test function in Excel is a useful reference for how these comparisons are implemented in a familiar tool.
The question that keeps you honest
The most useful question is not, “Is my sample large enough?”
It is, “Am I estimating variability, or do I somehow know it already?”
Once you ask that, the choice usually becomes clear. In textbooks, z-tests appear often because the assumptions are clean. In production experiments, t-tests appear often because your data is estimated, uneven, and imperfect. That is not a weakness of the t-test. It is why it is so useful.
Practical Walkthroughs with Python Code
A quick notebook test can save a team from shipping the wrong conclusion.
If you are comparing model scores, latency, or A/B results, Python gives you a fast way to test the idea and inspect the assumptions at the same time. For a good broader primer on AI programming with Python, that resource pairs well with the examples below. If you are setting up your environment, these examples also fit naturally with this guide to python libraries for data analysis.
The goal here is practical judgment, not memorizing a classroom rule. In real AI work, you almost never know the true population variance ahead of time, so the t-test is usually the tool you reach for. The z-test still matters, but mostly as a special case you should be able to defend clearly.
Rare case using a z-test
Suppose your team evaluates a new image model against a fixed benchmark process, and that process comes with a trusted historical mean and a known standard deviation. That is the textbook setup for a one-sample z-test.
import math
from scipy.stats import norm

# Known benchmark values
population_mean = 92
population_std = 3   # known sigma
sample_mean = 94
n = 50

# One-sample z-test statistic
z = (sample_mean - population_mean) / (population_std / math.sqrt(n))

# One-tailed p-value: is the new model better?
p_value = 1 - norm.cdf(z)

print("Z statistic:", z)
print("One-tailed p-value:", p_value)
Read the result in plain English:
- A small p-value means your sample would be unusual if the new model were not better.
- A larger p-value means the sample does not give strong enough evidence yet.
- The key assumption is doing the heavy lifting here.
population_stdis treated as known, not estimated.
That last point is where many people get tripped up. Using a z-test because the sample feels large is like using a recipe that assumes you already measured every ingredient perfectly. In production experiments, you usually have to estimate the variability from the data you collected.
Common case using Welch’s t-test
Now switch to a setup that looks much more like everyday product or ML work. You ran an A/B test on two chatbot interfaces and want to compare average session time. You have samples from each group, and each group may have a different spread.
import numpy as np
from scipy.stats import ttest_ind

# Example sample session times in minutes
group_a = np.array([11.8, 12.4, 10.9, 12.1, 13.0, 11.5, 12.2, 11.9])
group_b = np.array([13.2, 14.1, 12.8, 13.7, 13.4, 14.0, 12.9, 13.6])

# Welch's t-test (equal_var=False)
t_stat, p_value = ttest_ind(group_a, group_b, equal_var=False)

print("T statistic:", t_stat)
print("Two-tailed p-value:", p_value)
A few practical notes:
equal_var=Falseruns Welch’s t-test.- Welch’s version is a safer default when the two groups may not have the same variance.
- The output gives you the test statistic and p-value, but those numbers are only part of the story.
If your real question is directional, such as whether Group B performs better than Group A, decide that before checking results. Changing from a two-tailed question to a one-tailed question after seeing the data weakens the analysis.
Here’s a helpful video explanation if you like seeing the intuition visually before coding further:
How I’d read the output on a real project
Start with the p-value, then keep going.
First, check the group means. A statistically detectable difference that moves in the wrong direction is still the wrong product decision. Next, look at the spread and scan for outliers or strong skew. If one group has a few extreme values, the average can give a distorted picture.
Then ask whether the effect matters in practice. A tiny lift can be statistically significant in a large sample and still be meaningless for users, cost, or model quality. Finally, sanity-check the setup itself. Independent samples, reasonable data quality, and a metric that matches the product question matter as much as the test choice.
Python calculates the statistic in milliseconds. Your job is to judge whether the test matches the data you have.
Final Recommendations for AI and ML Practitioners
If you remember only one thing, remember this: for most AI and ML work, the t-test should be your default choice.
That’s not because z-tests are bad. It’s because their main requirement, known population variance, almost never holds in ordinary experimentation. Product metrics, model quality scores, latency samples, and user behavior all come with uncertainty that you estimate from data.
The advice I’d pin above your monitor
Default to Welch’s t-test: If you’re comparing two independent groups and don’t know the true population variance, Welch’s t-test is the safest starting point.
Retire the “n=30” myth: Sample size matters, but it isn’t the deciding factor people make it out to be. Data shape and variance assumptions matter more.
Look at the data before the test: Plot a histogram. Check for outliers. Scan for skew. A five-second visual pass can save you from a bad conclusion.
Use z-tests only when you can defend them: If someone asks, “How do you know the population variance?” you should have a strong answer, not a shrug.
The mistakes I see most often
One is using a z-test because the sample feels “large enough.” Another is assuming equal variances without checking, then using a standard two-sample t-test when Welch’s version would have been safer.
The biggest mistake, though, is treating statistical testing like a checkbox. In AI work, your result depends on the whole chain. Sampling, labeling, preprocessing, metric choice, and experiment design all shape whether the test result means anything.
Sound inference comes from matching the test to reality, not matching your data to a classroom shortcut.
That’s the practical difference between t test and z test. The z-test belongs to ideal conditions. The t-test belongs to the world most practitioners work in.
If you want more practical AI guides that explain technical topics without the fluff, visit YourAI2Day. It’s a solid place to keep learning about AI tools, data workflows, and real-world implementation.