A Practical Guide to Data Modelling Techniques
Ever tried to build a complex Lego set without the instruction booklet? You probably ended up with a wonky-looking spaceship and a handful of leftover pieces. Trying to build a data system without a solid model is a lot like that—it's a fast track to chaos, inconsistency, and a system that’s nearly impossible for anyone to manage or understand.
Data modeling isn't just one thing; it's a collection of different blueprints for organizing information inside a database. The most common approaches you'll run into are relational models, which are perfect for structured, everyday business data, and dimensional models, which are built for speed in analytics. Picking the right approach from the start is crucial—it's what makes the difference between data that's efficient, consistent, and easy to access, and a system that just doesn't work.
What Is Data Modelling and Why Does It Matter
So, what exactly is data modeling, and why should you care? Think of it as creating the blueprint for your data before you start building. It’s the foundational practice of mapping out your information, defining how different pieces relate to each other, and making sure every bit of data has a logical place to live. It turns a potential mess into an organized, predictable, and genuinely useful asset.
This isn't just a technical box-ticking exercise; it’s a strategic process that forces you to think deeply about what the business actually needs from its data.
The Blueprint for Your Data House
Before you write a single line of code to create a table, data modeling pushes you to answer the important questions:
- What are the core things we need to track? (e.g., customers, products, orders)
- How do these things connect? (e.g., a customer places an order for a product)
- What specific details do we need to know about each one? (e.g., a customer has a name, email, and shipping address)
This structured thinking has been the bedrock of data management for decades. The whole field really kicked off in 1970 when Edgar F. Codd published his paper on the relational model, completely changing how we store and query information. By the late 1980s, his ideas were the foundation for the databases that run pretty much everything. You can see a great overview of the history of data modeling and its milestones to get a sense of how we got here.
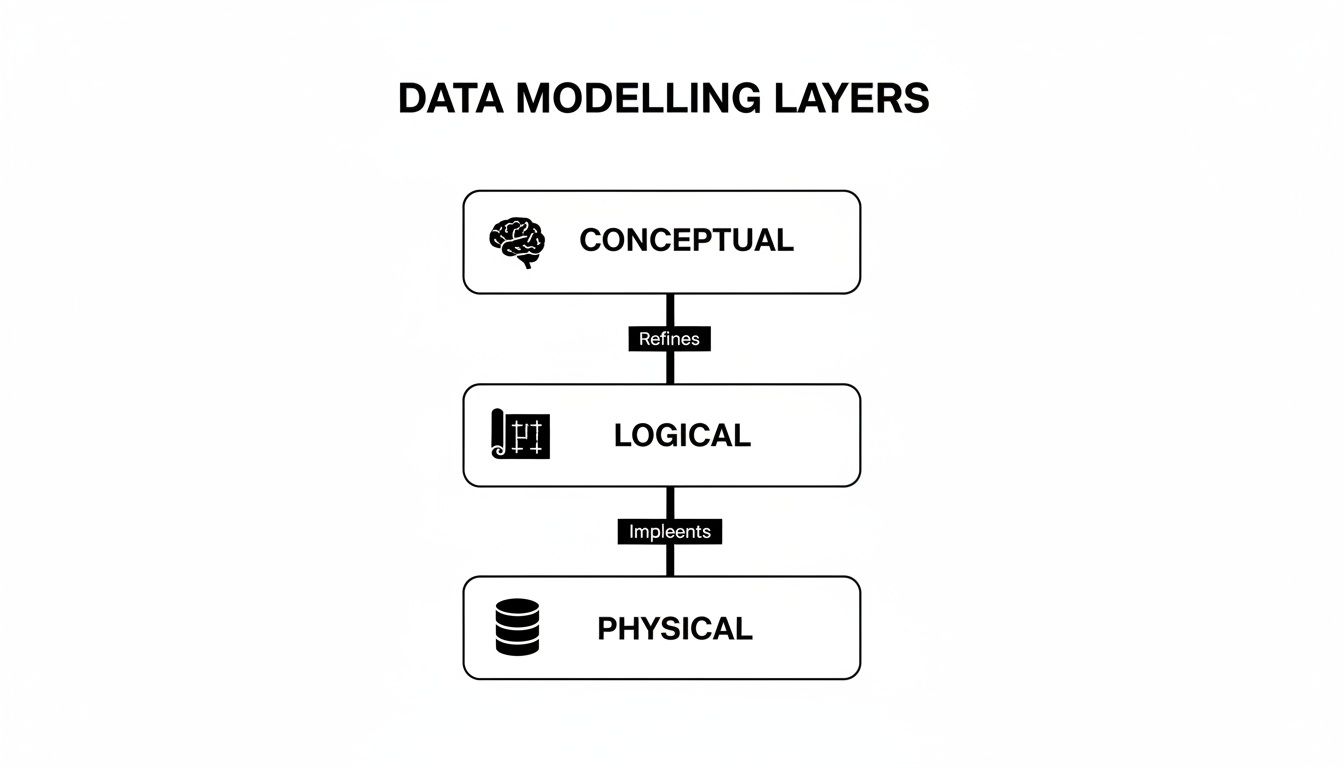
The Three Core Layers of Data Modelling
To get from a fuzzy idea to a concrete plan, we break the modeling process down into three distinct layers. Each one adds more detail, progressively taking you from a high-level business concept all the way down to a technical specification ready for implementation.
Expert Opinion: "A technically perfect model that doesn't solve a real business problem is just a digital paperweight. Always start by understanding the business need first—ask 'why' before you ask 'how'."
Here's a friendly breakdown of how the layers work:
- Conceptual Model: This is the 10,000-foot view. It sketches out the main business concepts and how they relate, using plain language. For an online store, it might just show that "Customers" can buy "Products." It's simple, non-technical, and all about business alignment.
- Logical Model: Now we zoom in. This layer adds more detail by defining the specific attributes for each concept (like
customer_nameorproduct_price) and clarifying the relationships between them (for instance, one customer can have many orders). It's a detailed blueprint, but it’s still database-agnostic—it doesn't care if you're using SQL Server, Postgres, or something else. - Physical Model: This is the final, most technical layer where the rubber meets the road. It maps the logical model to a specific database system, defining exact table names, column data types (
VARCHAR,INT,TIMESTAMP), and performance-tuning elements like indexes. This is the construction-ready plan that a database administrator can use to build the actual database.
Exploring Core Data Modelling Techniques
Alright, now that we’ve got the high-level architectural layers down, let's get our hands dirty with the actual blueprints. Different projects need different ways of structuring data, and picking the right approach is everything. Think of these data modelling techniques as a carpenter's toolkit—you wouldn't use a sledgehammer to drive a finishing nail, right?
We'll start with the battle-tested classics that have been the backbone of businesses for decades. Then, we'll dive into the more modern, flexible methods built for the messy, complex data challenges we face today. Each one gives you a unique way to organize information and connect the dots.
1. The Architectural Layers: From Big Idea to Database Schema
Before we jump into specific models, it’s crucial to understand that data modeling isn't a single step. It's a process that moves from a broad business concept to a detailed, technical implementation. This happens across three distinct layers.
Here's a quick breakdown of the journey:
- Conceptual Model: This is the 30,000-foot view. It's a high-level diagram that defines the key business concepts—the "things" we care about—and how they relate. It’s all about capturing business requirements, completely ignoring the technology. Think simple boxes and lines on a whiteboard, made for business stakeholders.
- Logical Model: Now we get a bit more technical. The logical model adds detail, defining attributes for each entity and specifying the relationships more clearly (like one-to-one or one-to-many). It’s still technology-agnostic, meaning you're not yet thinking about which specific database (like PostgreSQL or Oracle) you'll use. This is the architect's detailed blueprint.
- Physical Model: This is where the rubber meets the road. The physical model translates the logical blueprint into a concrete implementation for a specific database system. You're defining exact table names, column data types (like
VARCHAR(255)orINT), primary keys, and foreign keys. This is the final, ready-to-build schematic for the database developers.
Understanding this progression is key because it ensures that what gets built actually solves the original business problem.
2. The Foundation: Relational and ER Models
The Entity-Relationship (ER) model is the undisputed classic of the data modeling world. It's the sturdy, reliable foundation that countless applications have been built on for decades. The core idea is brilliantly simple: you figure out the main "things" or entities your business deals with (like Customers, Products, and Orders) and then map out the relationships between them.
For example, a Customer places an Order, and an Order contains Products. These concepts are then turned into neatly organized tables with rows and columns, creating a relational database. This structure is fantastic for enforcing data consistency and integrity, which is why it's the absolute standard for transactional systems like e-commerce platforms, banking apps, and inventory management.
3. Built for Speed: Dimensional Models
While ER models are champs at recording transactions accurately, they often stumble when you need to run fast, complex analytics. That’s where dimensional modeling steps in. This technique is purpose-built for business intelligence and data warehousing, tossing aside the strict normalization rules of ER models in favor of blazing-fast query performance.
The two most common schemas you'll run into are:
- Star Schema: This is the simplest and most popular dimensional model. It’s built around a central fact table (holding the numbers and metrics you care about, like
sales_amountorquantity_sold) which is directly connected to several dimension tables (holding the descriptive context, likecustomer_details,product_info, ordate). It looks like a star, hence the name. - Snowflake Schema: Think of this as a more complex version of the star schema. Here, the dimension tables are themselves broken down—or normalized—into smaller, related tables. While this approach can save a bit of storage space by reducing data redundancy, it also adds complexity and can slow down queries because the database has to perform more joins.
Most analysts and data engineers start with a star schema because it's intuitive and incredibly fast for slicing and dicing data.
4. Embracing Flexibility: NoSQL Models
Let's be honest, the real world's data isn't always neat and tidy. For apps dealing with unstructured data, semi-structured data, or information that changes on the fly, the rigid tables of relational models can feel like a straightjacket. This is where NoSQL (Not Only SQL) data models come to the rescue, offering incredible flexibility and scalability.
Two popular flavors are:
- Document Models: These are a dream for web developers and content management systems. Instead of tables, data is stored in flexible, JSON-like documents. A single
user_profiledocument, for instance, can hold everything about a user—name, address, past orders, and site preferences—all in one self-contained package. This completely avoids the need for complex joins and makes fetching data lightning-fast. - Graph Models: When the relationships between your data points are the most important part of the story, graph models are your best friend. Picture a social network: you have
People(nodes) connected byFriendships(edges). Graph databases are masters at navigating these complex, interconnected webs, making them perfect for building recommendation engines, detecting fraud rings, and analyzing network infrastructure.
Expert Opinion: "A huge part of modern data work is moving from massive, thousand-line SQL scripts to modular, accessible models. The goal is to break work into clean, separated concerns so that anyone can understand how the data is being prepared for its final use."
Choosing the right data modeling technique really comes down to what you're trying to achieve. Do you need the rock-solid consistency of a relational model, the analytical horsepower of a dimensional model, or the anything-goes flexibility of NoSQL? Understanding your options is the first and most critical step.
Comparing Popular Data Modelling Techniques
To make things a bit clearer, here’s a quick-glance comparison of the most common data modeling techniques. This should help you get a feel for which approach might be the best fit for your next project.
| Technique | Best For | Structure | Key Feature |
|---|---|---|---|
| Relational (ER) | Transactional systems (OLTP), applications requiring high data integrity. | Tables with rows and columns, linked by keys. | Enforces strict consistency and normalization (ACID compliance). |
| Dimensional (Star) | Data warehousing, business intelligence (BI), and analytics (OLAP). | Central fact table surrounded by descriptive dimension tables. | Optimized for fast queries and easy-to-understand reporting. |
| Document (NoSQL) | Content management, mobile apps, IoT, and catalogs. | Flexible, JSON-like documents in collections. | Schema-on-read flexibility; no need for predefined structure. |
| Graph (NoSQL) | Social networks, recommendation engines, fraud detection. | Nodes (entities) and edges (relationships). | Excels at navigating and analyzing complex, interconnected data. |
Ultimately, there's no single "best" model—only the one that is best suited for your specific use case. By starting with the end goal in mind, you can select the right blueprint and build a data solution that is both powerful and efficient.
How the Right Data Model Makes AI Genuinely Smart
An AI model is really only as good as the data it’s trained on. Think of data modeling as the private tutor that gets that data ready for a top-tier education—making sure it’s clean, organized, and primed for learning. Getting the data model right isn’t just some technical box-checking exercise; it’s the bedrock of any successful AI or machine learning project.
This is where the right data modeling techniques become your secret weapon. They take raw, chaotic information and turn it into a structured asset that an algorithm can actually understand and use to make intelligent predictions. Without a solid model, you're basically just throwing a jumbled mess of data at your AI and crossing your fingers.
From Clean Data to Smarter Predictions
For a lot of machine learning tasks, a clean, predictable data source is non-negotiable. This is where the classic relational model really proves its worth. By arranging data into well-defined tables with crystal-clear relationships, you create the perfect environment for something called a feature store.
A feature store is basically a central hub for pre-calculated variables—or features—that machine learning models need for training and making predictions. For example, a relational model for an online store would have tables for customers, orders, and products. From there, you could engineer features like a customer's lifetime spending, their average order value, or how many items they bought in the last 30 days.
Expert Opinion: "A huge part of modern data work is moving from massive, thousand-line SQL scripts to modular, accessible models. The goal is to break work into clean, separated concerns so that anyone can understand how the data is being prepared for its final use."
When you have these features neatly organized and consistently refreshed, your algorithms get a steady diet of high-quality, reliable data. This process, known as feature engineering, is a critical step in building accurate models. To really get into the weeds on this, check out this complete guide to feature engineering for machine learning, which breaks down how to create powerful variables from raw data.
Uncovering Hidden Connections with Graph Models
Some of the most powerful AI applications today are all about understanding relationships. Ever wonder how Netflix just knows what you want to watch next, or how your bank flags a potentially sketchy transaction? These systems need to see beyond individual data points and map the intricate web of connections between them.
This is exactly where graph models step in. They are the powerhouse behind many of today's best recommendation engines and fraud detection platforms. A graph model represents data as a network of nodes (like people, products, or accounts) and edges (the relationships that link them together).
- For E-commerce: A graph can link you to products that people with similar tastes also viewed or bought, leading to scarily accurate recommendations.
- For Banking: It can spot suspicious activity by mapping out relationships between accounts, devices, and transaction locations that might point to a coordinated fraud ring.
These subtle patterns are often completely invisible in traditional table-based models. This gives graph-based AI a unique edge in sniffing out complex behaviors, since it's built to navigate these connections in a way other models simply can't.
Taming the Chaos for Large Language Models
The most advanced AI systems we have now, like the large language models (LLMs) behind chatbots and content creators, are trained on absolutely colossal datasets. This data is often a wild mix of unstructured and semi-structured content, pulling from web pages, books, images, and social media posts.
Trying to force all that messy, diverse information into a rigid relational database would be an absolute nightmare. It's just not what they're built for. This is precisely why flexible document models are so crucial for modern AI development.
Document databases store data in JSON-like formats, which handle different and evolving structures beautifully. A single document can hold text, nested data, and lists all in one place. This adaptability makes them the perfect tool for wrangling the vast, untidy datasets needed to train today's most powerful AI, letting developers iterate and experiment without being handcuffed to a rigid schema.
Essential Best Practices for Effective Data Modelling
Alright, we've covered the different blueprints. Now comes the fun part: turning that theory into practice. This is where the rubber meets the road. Let’s walk through a practical checklist of best practices that will help you build models that are more than just technically correct—they'll be efficient, scalable, and actually useful to the business.
The golden rule, before you do anything else, is to understand the business need. I can't stress this enough. A technically perfect model that doesn't solve a real-world problem is just a fancy digital paperweight. Your design must support clear business goals, answer the questions people are actually asking, and deliver the insights your stakeholders need to make better decisions.
Start with Clear Naming Conventions
Before you even think about creating a single table, stop and define a clear, consistent naming convention. This seemingly small step is a game-changer. It prevents countless hours of confusion and guesswork for your team down the line. Trust me on this one.
A good convention makes your model practically self-documenting. Here's a simple way to think about it:
- Use Prefixes: Slap a
dim_on dimension tables (dim_customers) andfct_on fact tables (fct_orders). It's a simple shorthand that instantly tells you what you're looking at. - Choose Clarity Over Brevity: Always use descriptive names like
customer_first_nameinstead of cryptic nonsense likecust_fnm. Your future self will thank you. - Be Consistent: Pick a style and stick with it. I'm a fan of
snake_case(all lowercase with underscores), but the important thing is to be consistent across all your objects.
This kind of discipline means anyone can look at your schema and immediately grasp what each piece is for.
Balance Normalization and Performance
One of the first concepts you'll bump into is normalization. Think of it as the art of eliminating data duplication. Instead of typing out a customer's full address in every single order they place, you store it just once in a customers table and simply link to it. This keeps your data clean, consistent, and much easier to maintain.
But there's a trade-off. A highly normalized model can sometimes bog down your analytical queries because you have to join a bunch of tables together to get a complete picture. This is where denormalization comes in. For reporting and analytics, it often makes sense to strategically re-introduce a little redundancy to make queries run faster.
The trick is to normalize your transactional data first (your source of truth), and then denormalize it specifically for analytical use cases where performance is king.
Expert Opinion: "A seasoned data architect once shared their number one piece of advice for beginners: 'Start simple and always ask 'why' before you ask 'how'. A simple model that meets 80% of the needs is far more valuable than a complex one that's perfect but impossible to maintain.'"
Plan for Future Growth
Your business isn't static, and your data needs won't be either. A model built only for today's problems will quickly become a major bottleneck. You have to build with scalability in mind right from the get-go.
Start thinking about the future:
- Will the company expand into new regions? If so, you'll need to handle different currencies or languages.
- Are new product lines on the horizon? They might introduce completely new kinds of data.
- Could your data volume explode by 10x or even 100x in the next few years?
Designing with this forward-looking mindset—using flexible data types, avoiding hard-coded logic, and anticipating growth—will save you from incredibly painful and expensive redesigns down the road. This is where strong data governance best practices become your best friend, helping you manage this evolution and ensuring your model stays reliable and secure as it grows.
Modern Tools for Designing and Visualizing Data Models
Putting away the whiteboard and marker doesn't mean giving up on collaboration; it just means upgrading your toolkit. Modern software makes the entire process of applying data modelling techniques faster, more accurate, and far more collaborative. Today’s tools can take you from a rough sketch on a digital napkin to a fully deployable database schema with incredible efficiency.
These platforms aren't just for drawing pretty pictures. They're powerful environments that enforce database rules, track every change, and help teams speak the same visual language. Let's dig into the essential tools that data professionals have in their arsenal.

Visual Diagramming and Brainstorming Tools
Right at the start of a project, during the conceptual modeling phase, it's all about clarity and getting everyone on the same page. You need a space where business folks and technical teams can map out the big ideas without getting lost in database jargon.
This is where visual diagramming tools are worth their weight in gold. They act as a digital whiteboard, perfect for those initial brainstorming sessions.
- Lucidchart: A go-to choice for creating clean flowcharts, ERDs, and other diagrams. Its intuitive drag-and-drop interface means anyone can jump in and contribute.
- Miro: Think of this as a massive, freeform digital canvas. Miro is fantastic for collaborative brainstorming and is ideal for mind-mapping entities and relationships before you start formalizing them.
These tools are brilliant for hashing out the "big picture" and making sure everyone agrees on the business needs before you dive into the technical details.
Specialized Data Modeling Platforms
Once you move past the conceptual sketches and into logical and physical modeling, you need more specialized firepower. These platforms are built from the ground up for designing, documenting, and actually implementing databases.
Expert Opinion: "The biggest advantage of a dedicated modeling tool is its ability to forward and reverse engineer. You can generate a database schema directly from your visual model, and you can also create a visual model from an existing database—it’s a massive time-saver for documentation and maintenance."
Powerful tools like SqlDBM and Erwin by Quest offer features that go way beyond simple diagramming. They let you define tables, specify data types, set up primary and foreign keys, and enforce constraints with absolute precision. Many can even auto-generate the SQL code needed to build the database, which cuts down on manual errors tremendously.
Of course, once the model is built, developers still need to interact with the data. For those working in Python, understanding how to manipulate that data is key; you can explore our guide on essential Python libraries for data analysis to see how code and data models connect.
A Typical Professional Workflow
So, how does this all fit together on a real-world project? A professional data modeling workflow usually looks something like this:
- Requirement Gathering: Kick things off in a tool like Miro. Brainstorm with stakeholders, ask questions, and create a simple conceptual model that captures the business logic.
- Logical Design: Transition to a specialized platform like SqlDBM to build out the detailed logical model. This is where you formally define all entities, attributes, and relationships.
- Team Collaboration: Share the model with the rest of the team for review. These tools have built-in version control and commenting, making it easy to track feedback and manage changes.
- Physical Implementation: Convert the logical model into a physical one. Here, you'll make database-specific choices, selecting the right data types for your target system (e.g., PostgreSQL or Snowflake).
- Schema Generation: Use the tool’s forward-engineering feature to automatically generate the SQL script to create your database tables. No more typing
CREATE TABLEby hand! - Documentation and Maintenance: The visual model now becomes living documentation for your database. As business needs change, you can update the model first, keeping everything in sync.
Building a Simple Data Model From Start to Finish
Theory is one thing, but the best way to really get a feel for data modeling is to roll up our sleeves and build something. Let's walk through a practical example from scratch: designing a simple data model for a blog's content recommendation system.
The goal is pretty straightforward: we want to understand who our readers are, what articles they're reading, and what topics they find interesting. Armed with that knowledge, we can start suggesting other posts they might like. To get there, we’ll move through the three core layers of data modeling—from a high-level idea all the way down to a concrete database plan.

Step 1: The Conceptual Model
First, we start at the 30,000-foot view. The conceptual model is all about identifying the main "things" or concepts that matter to our project. Think of it as a whiteboard sketch—no technical jargon, no data types, just the core ideas.
For our recommendation engine, we can boil it down to three key entities:
- Users: The people visiting our blog.
- Articles: The posts we publish.
- Topics: The categories we use to organize our articles, like "AI," "Data Science," or "Machine Learning."
The relationships between them are simple, too. A User reads an Article, and an Article belongs to a Topic. That’s it. This high-level map gets everyone, from the content team to the developers, on the same page about what we're actually trying to build.
Step 2: The Logical Model
With the big picture sorted, it's time to add some detail. The logical model takes our conceptual sketch and starts to flesh it out, defining the specific attributes for each entity and clarifying how they connect. It's like turning an architect's initial drawing into a proper blueprint.
Here's how we can break down our entities:
- User: Will need a unique
UserID, aUsername, and anEmail. - Article: Should have an
ArticleID,Title,PublicationDate, and itsContent. - Topic: Requires a
TopicIDand aTopicName.
Now, we get more precise about the relationships. A single User can read many Articles (a one-to-many relationship). We'll also say an Article can only belong to one Topic for simplicity (another one-to-many). But how do we track which user read which article? We need a "bridge" or linking table, which we can call ReadHistory. It will simply connect a UserID to an ArticleID.
Expert Opinion: "The logical model is where the real design work happens. Getting the relationships and attributes right at this stage saves you from massive headaches down the road. It’s truly the heart of the entire process."
Step 3: The Physical Model
This is where the rubber meets the road. The physical model translates our logical blueprint into a concrete schema for a specific database technology—let’s say we’re using PostgreSQL. We're now defining exact table names, column data types (INT, VARCHAR, DATE), and the keys that enforce our rules.
Our final database tables would look something like this:
- Users (
UserIDINT PRIMARY KEY,UsernameVARCHAR,EmailVARCHAR) - Topics (
TopicIDINT PRIMARY KEY,TopicNameVARCHAR) - Articles (
ArticleIDINT PRIMARY KEY,TitleVARCHAR,PublicationDateDATE,TopicIDINT FOREIGN KEY) - ReadHistory (
UserIDINT FOREIGN KEY,ArticleIDINT FOREIGN KEY)
And there we have it. By moving through these three stages, we've gone from a simple business idea to a fully implementable database schema. This structured approach ensures the final model is logical, efficient, and perfectly aligned with our original goal.
Common Questions About Data Modelling
Jumping into data modelling can feel a bit overwhelming, and it's natural for questions to pop up. Let's walk through some of the most common ones I hear from people just getting started.
What’s the Toughest Nut to Crack in Data Modelling?
Believe it or not, the hardest part of data modelling rarely involves the tech itself. The real challenge is translating messy, real-world business needs into a clear, logical structure. You can build the most elegant, technically sound model in the world, but if it doesn't actually help the business answer its questions or solve a real problem, it's essentially useless.
This initial discovery phase is all about communication. It demands digging deep, asking the right questions, and truly understanding what the people using the data are trying to achieve.
Expert Opinion: "A technically perfect model that doesn't solve a real business problem is just a digital paperweight. Always start by understanding the business need first—ask 'why' before you ask 'how'."
How Do I Pick the Right Data Modelling Technique?
The best technique is always the one that fits the job. The first question you should always ask is: What do we need this data to do? The answer will point you in the right direction.
Think of it like choosing the right tool for a project:
- Handling Daily Business? For recording transactions like sales, inventory updates, or customer orders, you need precision and consistency. A relational (ER) model is the classic, reliable choice here.
- Running Reports and Analysis? When the goal is to slice and dice data for business intelligence, you need speed. A dimensional model (like a star schema) is optimized for exactly this kind of fast querying.
- Managing Evolving Data? If your data is unstructured and changes often, like with user profiles or product catalogs on a website, a flexible NoSQL document model is your best friend.
- Uncovering Relationships? When the connections between data points are the main event—think social networks or fraud detection—a graph model is purpose-built to map out those complex relationships.
Is Data Modelling Obsolete with AI and Big Data?
Not at all. In fact, it’s more critical than ever. It's easy to think that AI can just magically make sense of a giant data swamp, but the reality is that machine learning algorithms thrive on clean, well-organized data.
A solid data model acts as the bedrock for effective AI. It turns raw, chaotic information into a structured, reliable asset that models can actually learn from. Without it, you're just feeding garbage into your algorithms, and you'll get garbage out. Good data modelling is what makes powerful AI and ML results possible.
At YourAI2Day, we break down complex AI topics to give you the clarity you need. Explore our articles and resources to stay ahead of the curve at https://www.yourai2day.com.